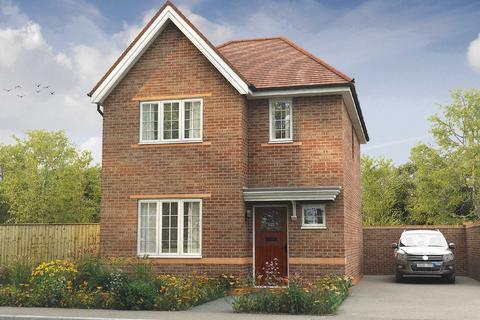
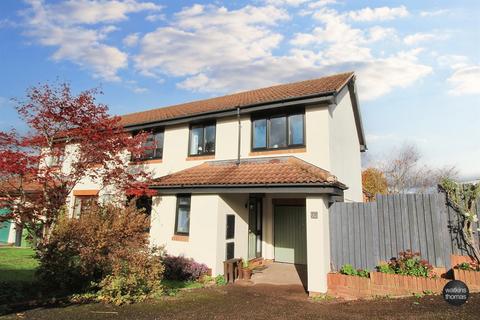
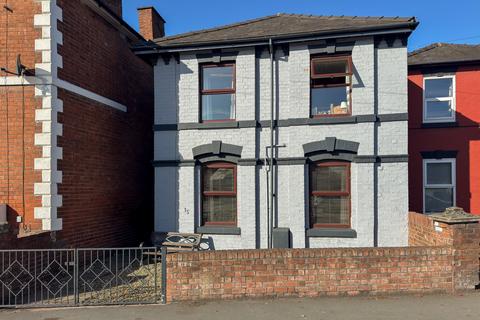
33 Langland Drive, Hereford, HR4 0QG
Detached house
Freehold
Track this property
Sales timeline
- sold22 July 2022£325,000+£94,500 (+40%)
- sold03 November 2017£230,500+£165,500 (+254%)
- sold09 November 1998£65,000
Sold prices provided by Land Registry/Registers of Scotland
Similar homes sold
Similar homes for sale
Local market insights: HR4 0QG
Current asking prices
Average
£331,659

| Type | 1 Bed | 2 Bed | 3 Bed | 4 Bed | 5 Bed |
|---|---|---|---|---|---|
| Houses | £163,333 | £218,627 | £306,775 | £455,114 | £711,666 |
| Flats | £119,647 | £217,800 | £150,000 | - | - |
| All | £136,937 | £221,911 | £328,730 | £458,681 | £731,428 |
Current rental prices (pcm)
Average
£900

| Type | 1 Bed | 2 Bed | 3 Bed | 4 Bed | 5 Bed |
|---|---|---|---|---|---|
| Houses | £655 | £881 | £1,225 | £1,542 | - |
| Flats | £696 | £898 | - | - | - |
| All | £591 | £889 | £1,254 | £1,542 | - |