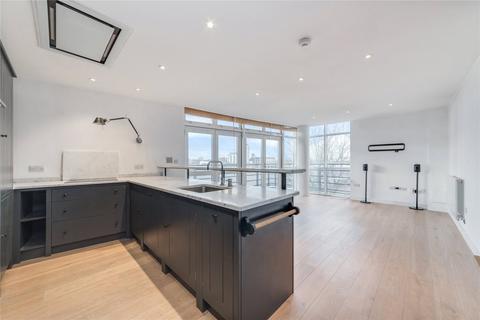
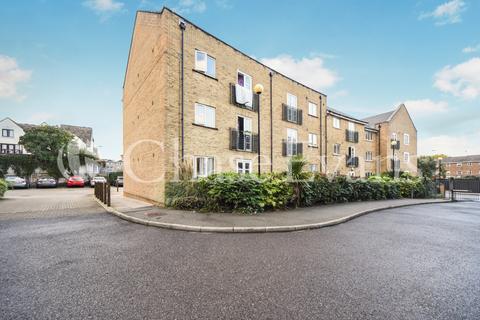
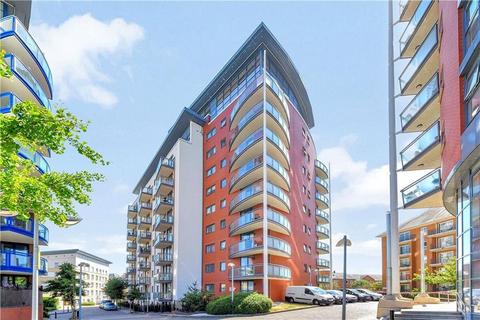
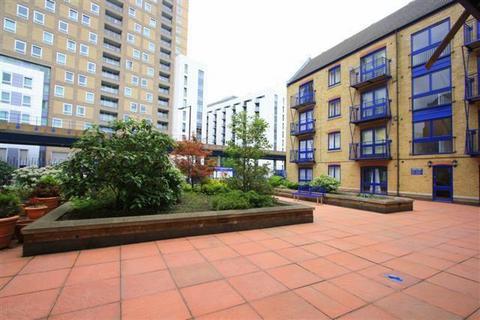
129 Langbourne Place, London, E14 3WW
Flat
Leasehold
Track this property
Sales timeline
- sold22 November 2024£395,000+£55,000 (+16%)
- sold19 February 2015£340,000+£90,001 (+36%)
- sold12 August 2011£249,999+£49 (<1%)
- sold09 October 2006£249,950+£64,950 (+35%)
- sold30 January 2004£185,000+£27,000 (+17%)
- sold07 April 2000£158,000
Sold prices provided by Land Registry/Registers of Scotland
Similar homes sold
Similar homes for sale


Local market insights: E14 3WW
Current asking prices
Average
£631,882

| Type | 1 Bed | 2 Bed | 3 Bed | 4 Bed | 5 Bed |
|---|---|---|---|---|---|
| Houses | £355,000 | £606,250 | £790,926 | £913,750 | £1,224,500 |
| Flats | £454,634 | £680,541 | £956,684 | £1,875,526 | £6,100,000 |
| All | £453,471 | £677,730 | £939,506 | £1,338,721 | £1,667,727 |
Current rental prices (pcm)
Average
£1,829

| Type | 1 Bed | 2 Bed | 3 Bed | 4 Bed | 5 Bed |
|---|---|---|---|---|---|
| Houses | £1,798 | £2,736 | £2,886 | £2,856 | £2,202 |
| Flats | £1,422 | £1,960 | £2,645 | £1,899 | - |
| All | £1,388 | £1,974 | £2,639 | £2,104 | £2,181 |