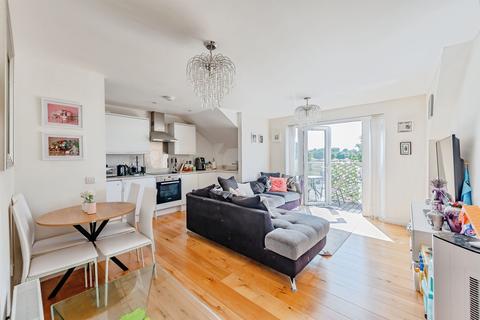
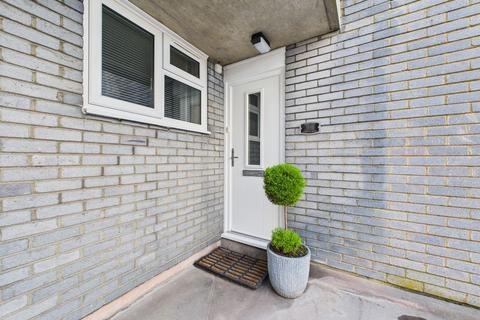
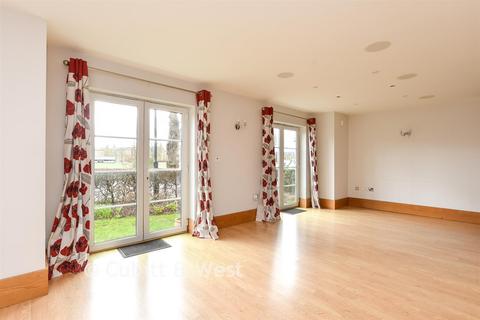
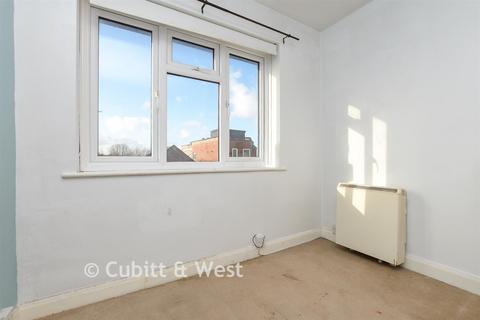
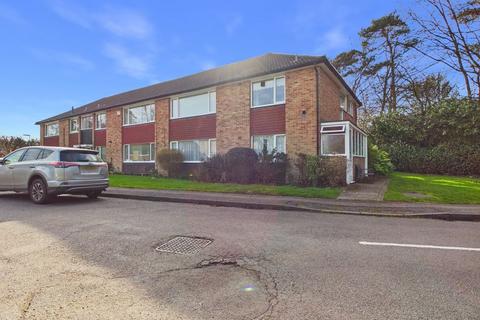
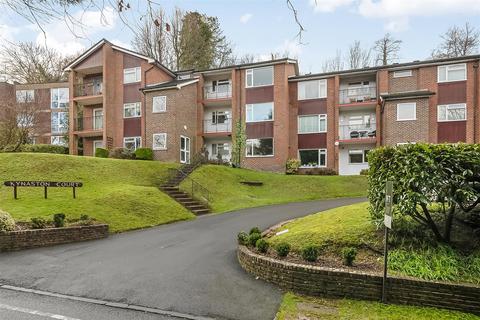
53 Bunce Drive, Caterham, CR3 5FG
Flat
Leasehold
Track this property
Sales timeline
- sold05 May 2022£256,750+£65,750 (+34%)
- sold23 May 2014£191,000+£3,000 (+1%)
- sold13 June 2008£188,000+£9,500 (+5%)
- sold18 February 2005£178,500+£21,000 (+13%)
- sold26 September 2003£157,500+£28,500 (+22%)
- sold31 January 2002£129,000+£19,000 (+17%)
- sold31 March 2000£110,000+£17,500 (+18%)
- sold28 June 1999£92,500+£12,550 (+15%)
- sold07 July 1998£79,950
Sold prices provided by Land Registry/Registers of Scotland
Similar homes sold


Similar homes for sale


Local market insights: CR3 5FG
Current asking prices
Average
£537,833

| Type | 1 Bed | 2 Bed | 3 Bed | 4 Bed | 5 Bed |
|---|---|---|---|---|---|
| Houses | £279,975 | £395,565 | £522,900 | £832,387 | £1,610,851 |
| Flats | £192,314 | £278,319 | £417,727 | - | £900,000 |
| All | £184,549 | £303,491 | £535,098 | £820,927 | £1,628,627 |
Current rental prices (pcm)
Average
£2,199

| Type | 1 Bed | 2 Bed | 3 Bed | 4 Bed | 5 Bed |
|---|---|---|---|---|---|
| Houses | - | - | £2,200 | - | £6,475 |
| Flats | £1,131 | £1,658 | £1,588 | - | - |
| All | £1,071 | £1,658 | £1,955 | - | £6,475 |