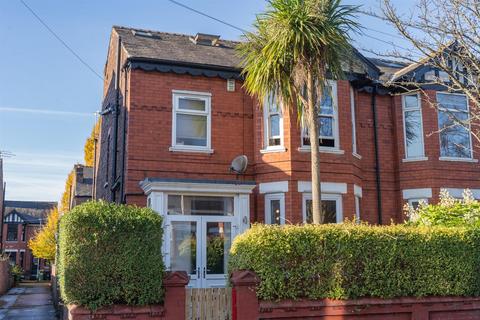
8 Morland Road, Manchester, M16 9PA
Semi-detached house
Leasehold
Track this property
Sales timeline
- sold29 October 2013£240,000+£30,000 (+14%)
- sold05 August 2011£210,000+£35,001 (+20%)
- sold12 December 2008£174,999-£19,001 (-9%)
- sold15 April 2006£194,000+£48,250 (+33%)
- sold22 November 2002£145,750+£25,750 (+21%)
- sold26 June 2002£120,000+£71,000 (+144%)
- sold06 September 1999£49,000
Sold prices provided by Land Registry/Registers of Scotland
Similar homes sold
Local market insights: M16 9PA
Current asking prices
Average
£313,140

| Type | 1 Bed | 2 Bed | 3 Bed | 4 Bed | 5 Bed |
|---|---|---|---|---|---|
| Houses | - | £345,000 | £369,147 | £526,923 | £706,833 |
| Flats | £191,796 | £273,971 | £364,744 | - | £560,000 |
| All | £188,350 | £274,130 | £367,001 | £526,923 | £700,960 |
Current rental prices (pcm)
Average
£1,243

| Type | 1 Bed | 2 Bed | 3 Bed | 4 Bed | 5 Bed |
|---|---|---|---|---|---|
| Houses | - | £1,250 | £1,688 | £2,098 | £3,600 |
| Flats | £980 | £1,235 | £1,588 | £2,340 | - |
| All | £927 | £1,235 | £1,627 | £2,118 | £3,600 |