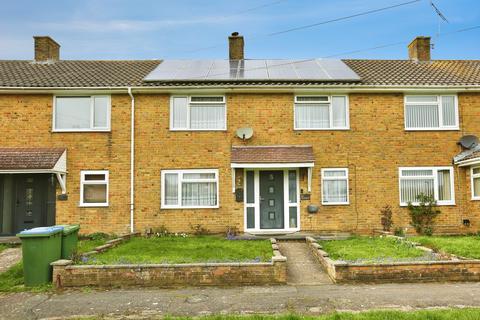
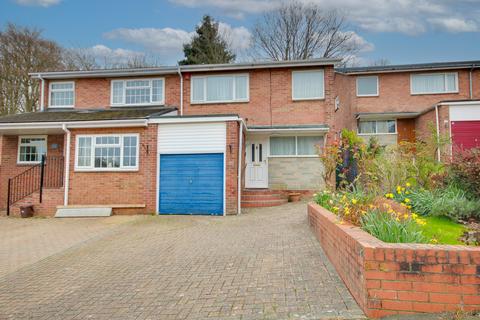
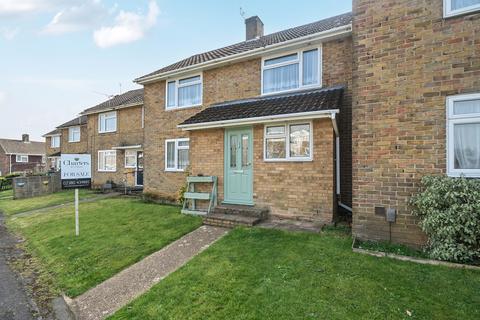
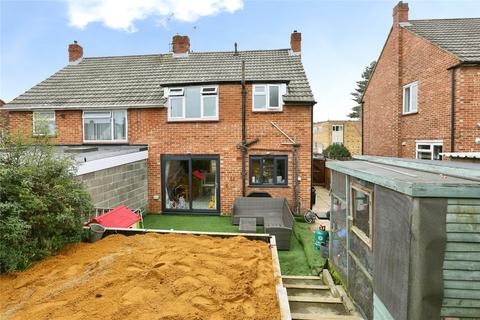
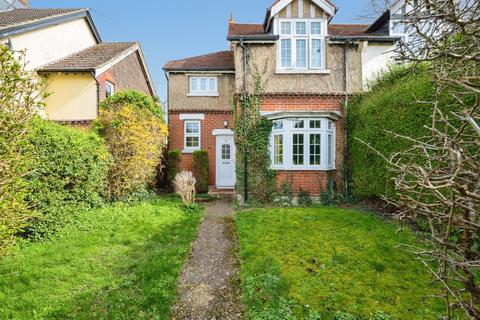
1 Onibury Close, Southampton, SO18 2DE
Detached house
Freehold
Track this property
Sales timeline
- sold05 February 2020£300,000+£74,000 (+32%)
- sold25 November 2014£226,000+£11,050 (+5%)
- sold27 May 2011£214,950+£64,450 (+42%)
- sold11 April 2002£150,500+£20,500 (+15%)
- sold14 August 2000£130,000+£82,000 (+170%)
- sold09 May 1997£48,000
Sold prices provided by Land Registry/Registers of Scotland
Similar homes sold
Similar homes for sale
Local market insights: SO18 2DE
Current asking prices
Average
£289,318

| Type | 1 Bed | 2 Bed | 3 Bed | 4 Bed | 5 Bed |
|---|---|---|---|---|---|
| Houses | £205,000 | £268,657 | £333,134 | £474,000 | £550,556 |
| Flats | £133,348 | £184,445 | £210,000 | - | £2,200,000 |
| All | £156,603 | £222,312 | £330,816 | £467,568 | £715,500 |
Current rental prices (pcm)
Average
£1,168

| Type | 1 Bed | 2 Bed | 3 Bed | 4 Bed | 5 Bed |
|---|---|---|---|---|---|
| Houses | - | £1,325 | £1,555 | £1,815 | £2,800 |
| Flats | £892 | £1,149 | £1,350 | - | - |
| All | £884 | £1,173 | £1,535 | £1,815 | £2,800 |