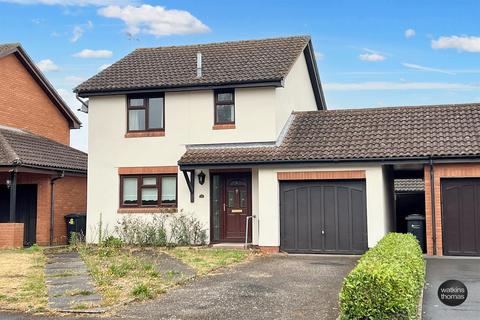
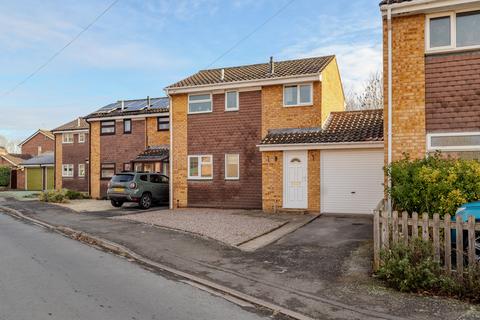
49 Langland Drive, Hereford, HR4 0QG
Semi-detached house
Freehold
Track this property
Sales timeline
- sold08 November 2019£284,950+£39,950 (+16%)
- sold24 March 2016£245,000+£35,000 (+16%)
- sold21 June 2011£210,000-£19,950 (-8%)
- sold26 March 2007£229,950+£32,450 (+16%)
- sold06 December 2005£197,500+£112,500 (+132%)
- sold01 August 2001£85,000
Sold prices provided by Land Registry/Registers of Scotland
Similar homes sold
Similar homes for sale


Local market insights: HR4 0QG
Current asking prices
Average
£331,962

| Type | 1 Bed | 2 Bed | 3 Bed | 4 Bed | 5 Bed |
|---|---|---|---|---|---|
| Houses | £163,333 | £218,627 | £306,795 | £454,916 | £711,666 |
| Flats | £119,647 | £215,893 | £150,000 | - | - |
| All | £136,937 | £221,503 | £328,747 | £458,141 | £731,428 |
Current rental prices (pcm)
Average
£879

| Type | 1 Bed | 2 Bed | 3 Bed | 4 Bed | 5 Bed |
|---|---|---|---|---|---|
| Houses | £655 | £881 | £1,206 | £1,542 | - |
| Flats | £696 | £898 | - | - | - |
| All | £591 | £889 | £1,249 | £1,542 | - |