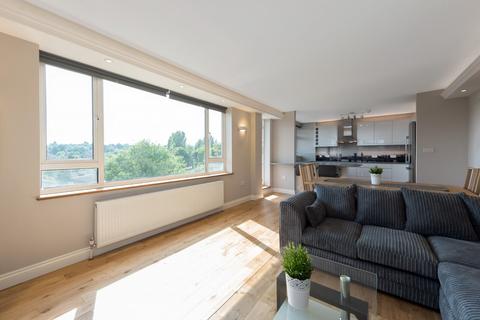
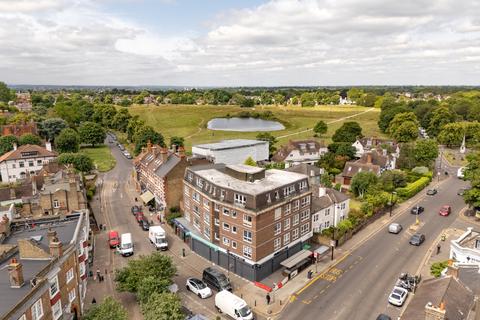
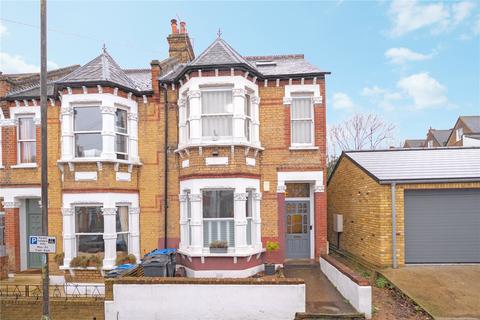
73 Chapman Square, London, SW19 5QU
Flat
Leasehold
Track this property
Sales timeline
- sold31 January 2024£735,000+£415,000 (+129%)
- sold12 April 2001£320,000+£45,000 (+16%)
- sold23 November 1999£275,000
Sold prices provided by Land Registry/Registers of Scotland
Similar homes sold

Similar homes for sale


Local market insights: SW19 5QU
Current asking prices
Average
£903,740

| Type | 1 Bed | 2 Bed | 3 Bed | 4 Bed | 5 Bed |
|---|---|---|---|---|---|
| Houses | £583,333 | £753,770 | £937,297 | £1,330,565 | £3,239,165 |
| Flats | £346,447 | £531,218 | £765,917 | £660,375 | £1,475,000 |
| All | £370,827 | £558,341 | £852,752 | £1,299,984 | £3,205,562 |
Current rental prices (pcm)
Average
£2,816

| Type | 1 Bed | 2 Bed | 3 Bed | 4 Bed | 5 Bed |
|---|---|---|---|---|---|
| Houses | £1,533 | £2,609 | £4,563 | £4,494 | £8,012 |
| Flats | £1,726 | £2,473 | £3,103 | £2,938 | - |
| All | £1,558 | £2,489 | £3,767 | £4,035 | £8,012 |